Audit Log
This procedure guide explains how to use the Audit Logs tab to view and manage audit trail records in your organization. The Audit Logs tab allows administrators to monitor system activities, track user actions, and review detailed logs of all operations.
Table of Contents
Section titled “Table of Contents”- Accessing the Audit Logs Tab
- Understanding the Audit Logs Table
- Filtering Audit Logs
- Viewing Log Details
- Viewing AI Responses and Messages
- Viewing Documents from Logs
- Sorting and Organizing Logs
- Customizing Table View
- Key Features Summary
- Best Practices
- Troubleshooting
- Security Notes
- Logged Actions
Accessing the Audit Logs Tab
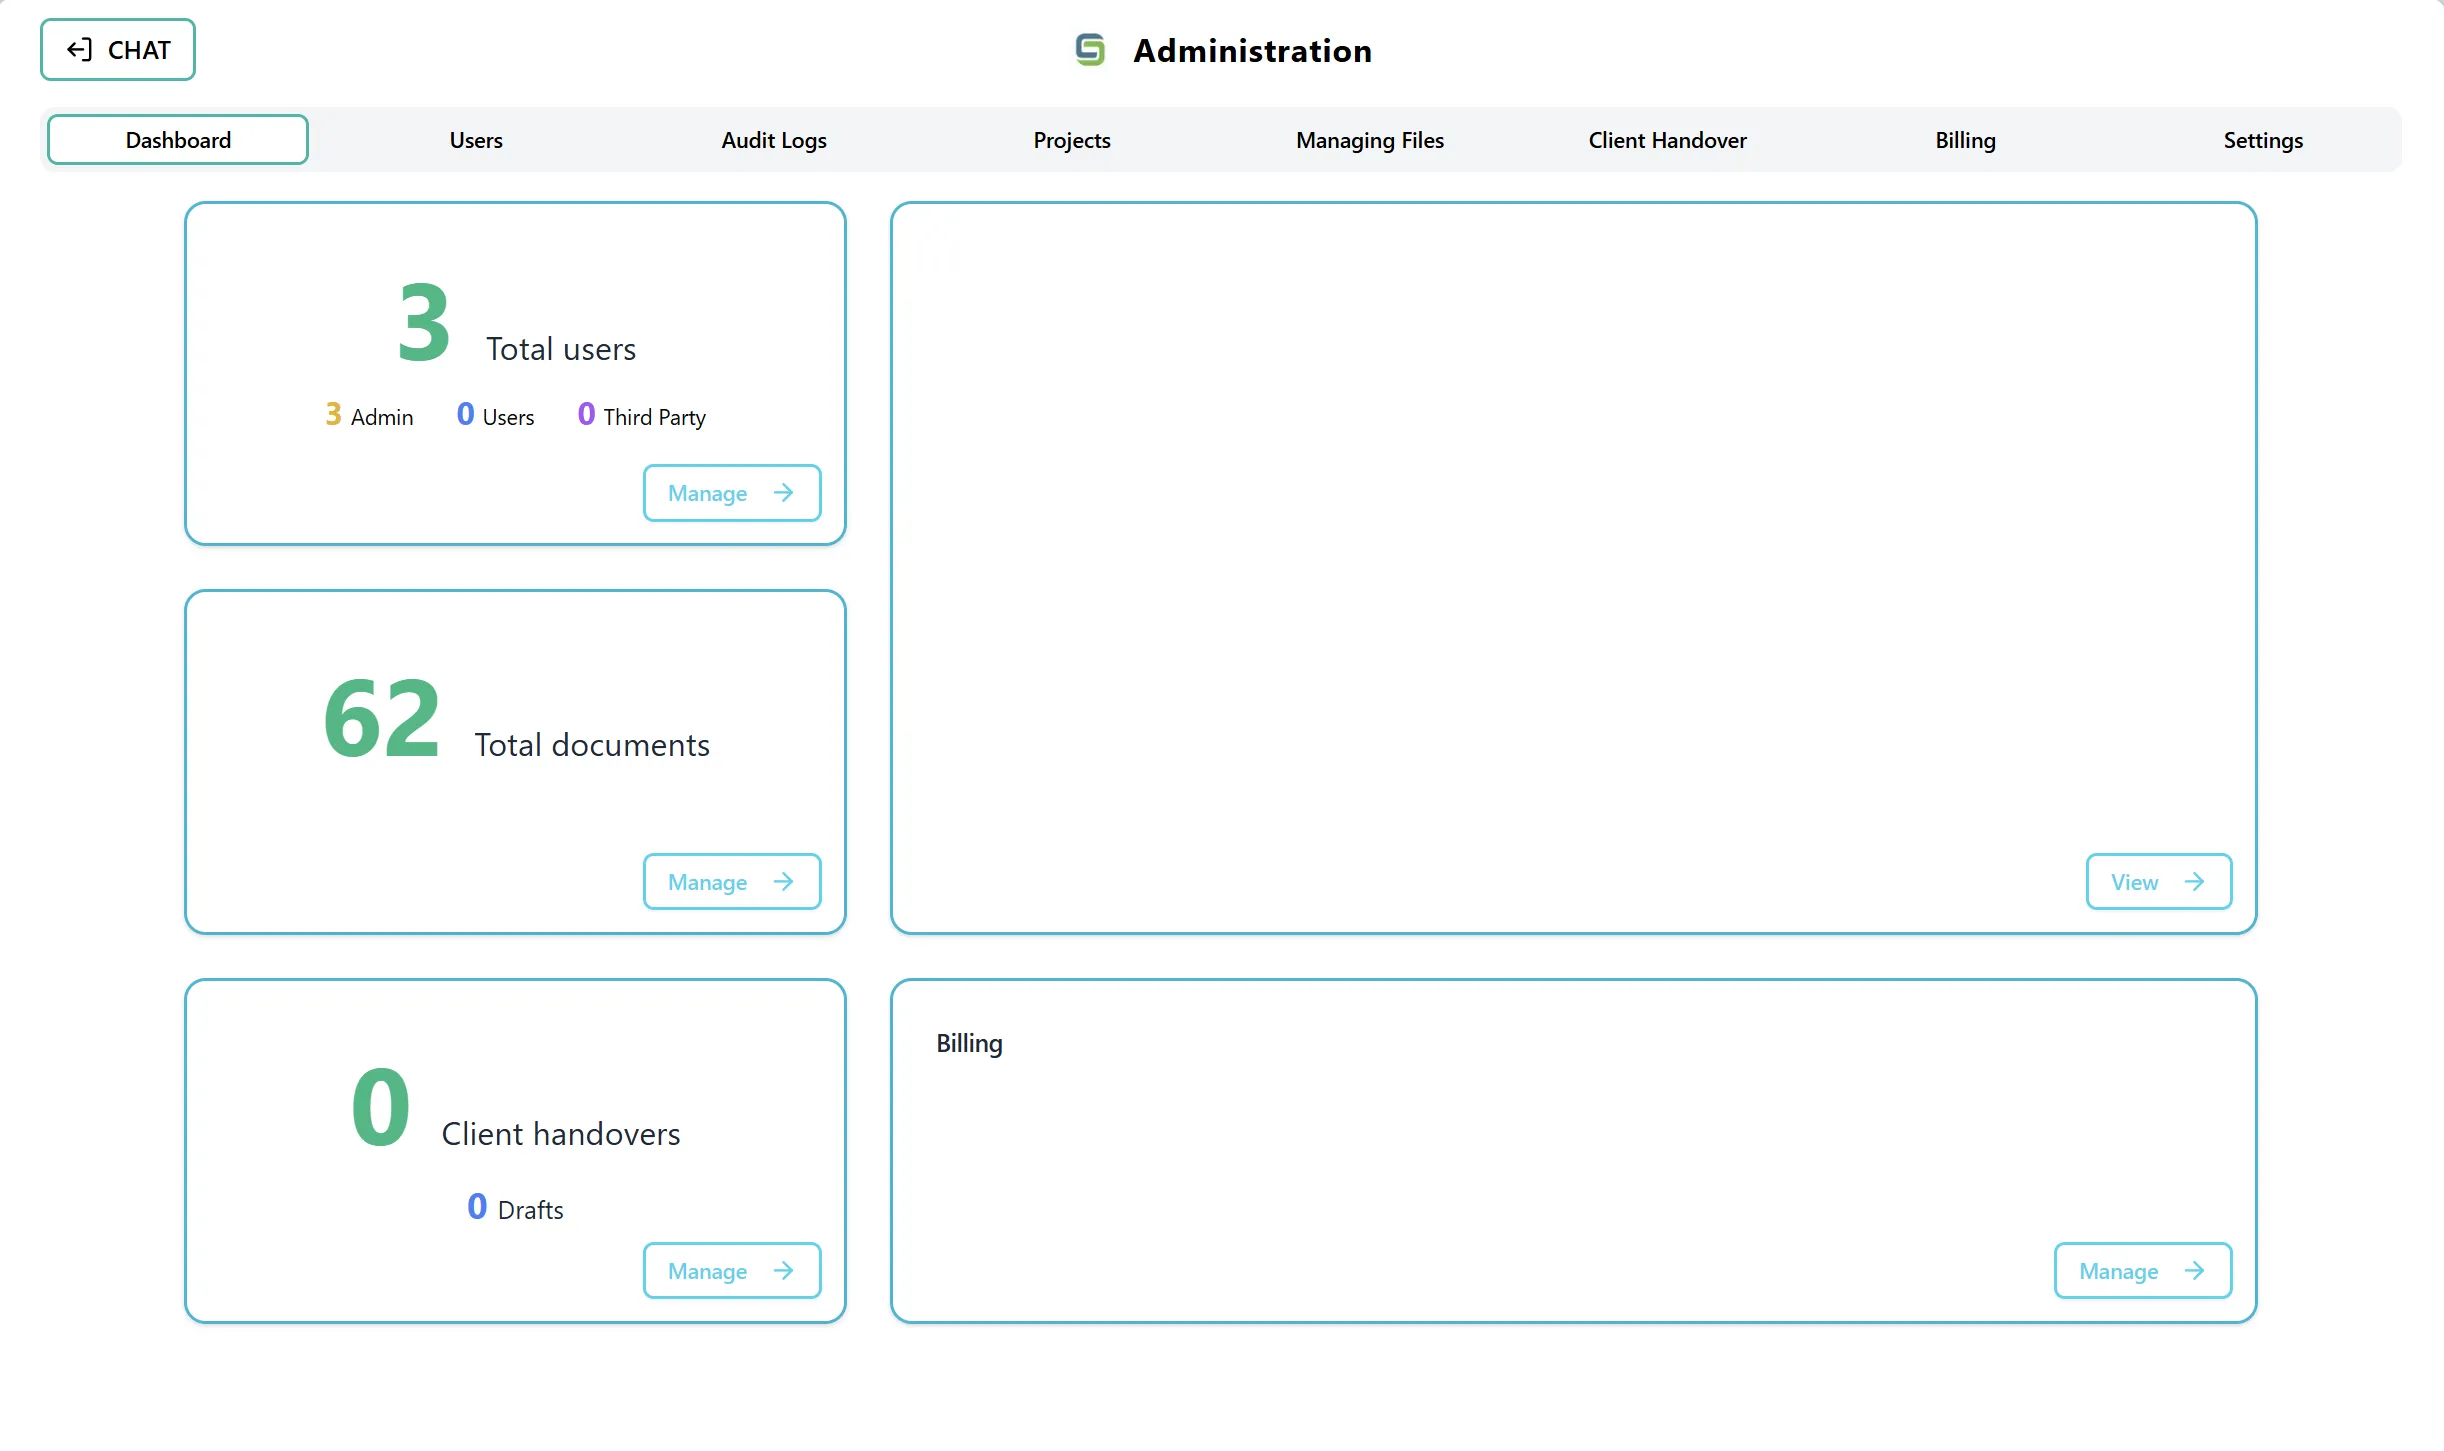
Section titled “Accessing the Audit Logs Tab”Step 1: Navigate to Admin Dashboard
Section titled “Step 1: Navigate to Admin Dashboard”- Log in to the application with admin privileges
- Navigate to the Admin Dashboard (typically accessible from the main navigation menu)
- The dashboard displays several cards showing statistics and quick access to different admin features
Step 2: Access the Audit Logs Tab
Section titled “Step 2: Access the Audit Logs Tab”You can access the Audit Logs tab in two ways:
Option A: Using the Audit Logs Card On the Admin Dashboard, you may see a card or section related to audit logs that displays audit log statistics.
Option B: Using the Navigation Tab You can directly select the “Audit Logs” or “Audit Logs” tab from the top navigation tabs in the Admin section. This tab is located alongside other admin sections such as Dashboard, Users, Projects, Managing Files, Client Handover, and Settings.
Understanding the Audit Logs Table
Section titled “Understanding the Audit Logs Table”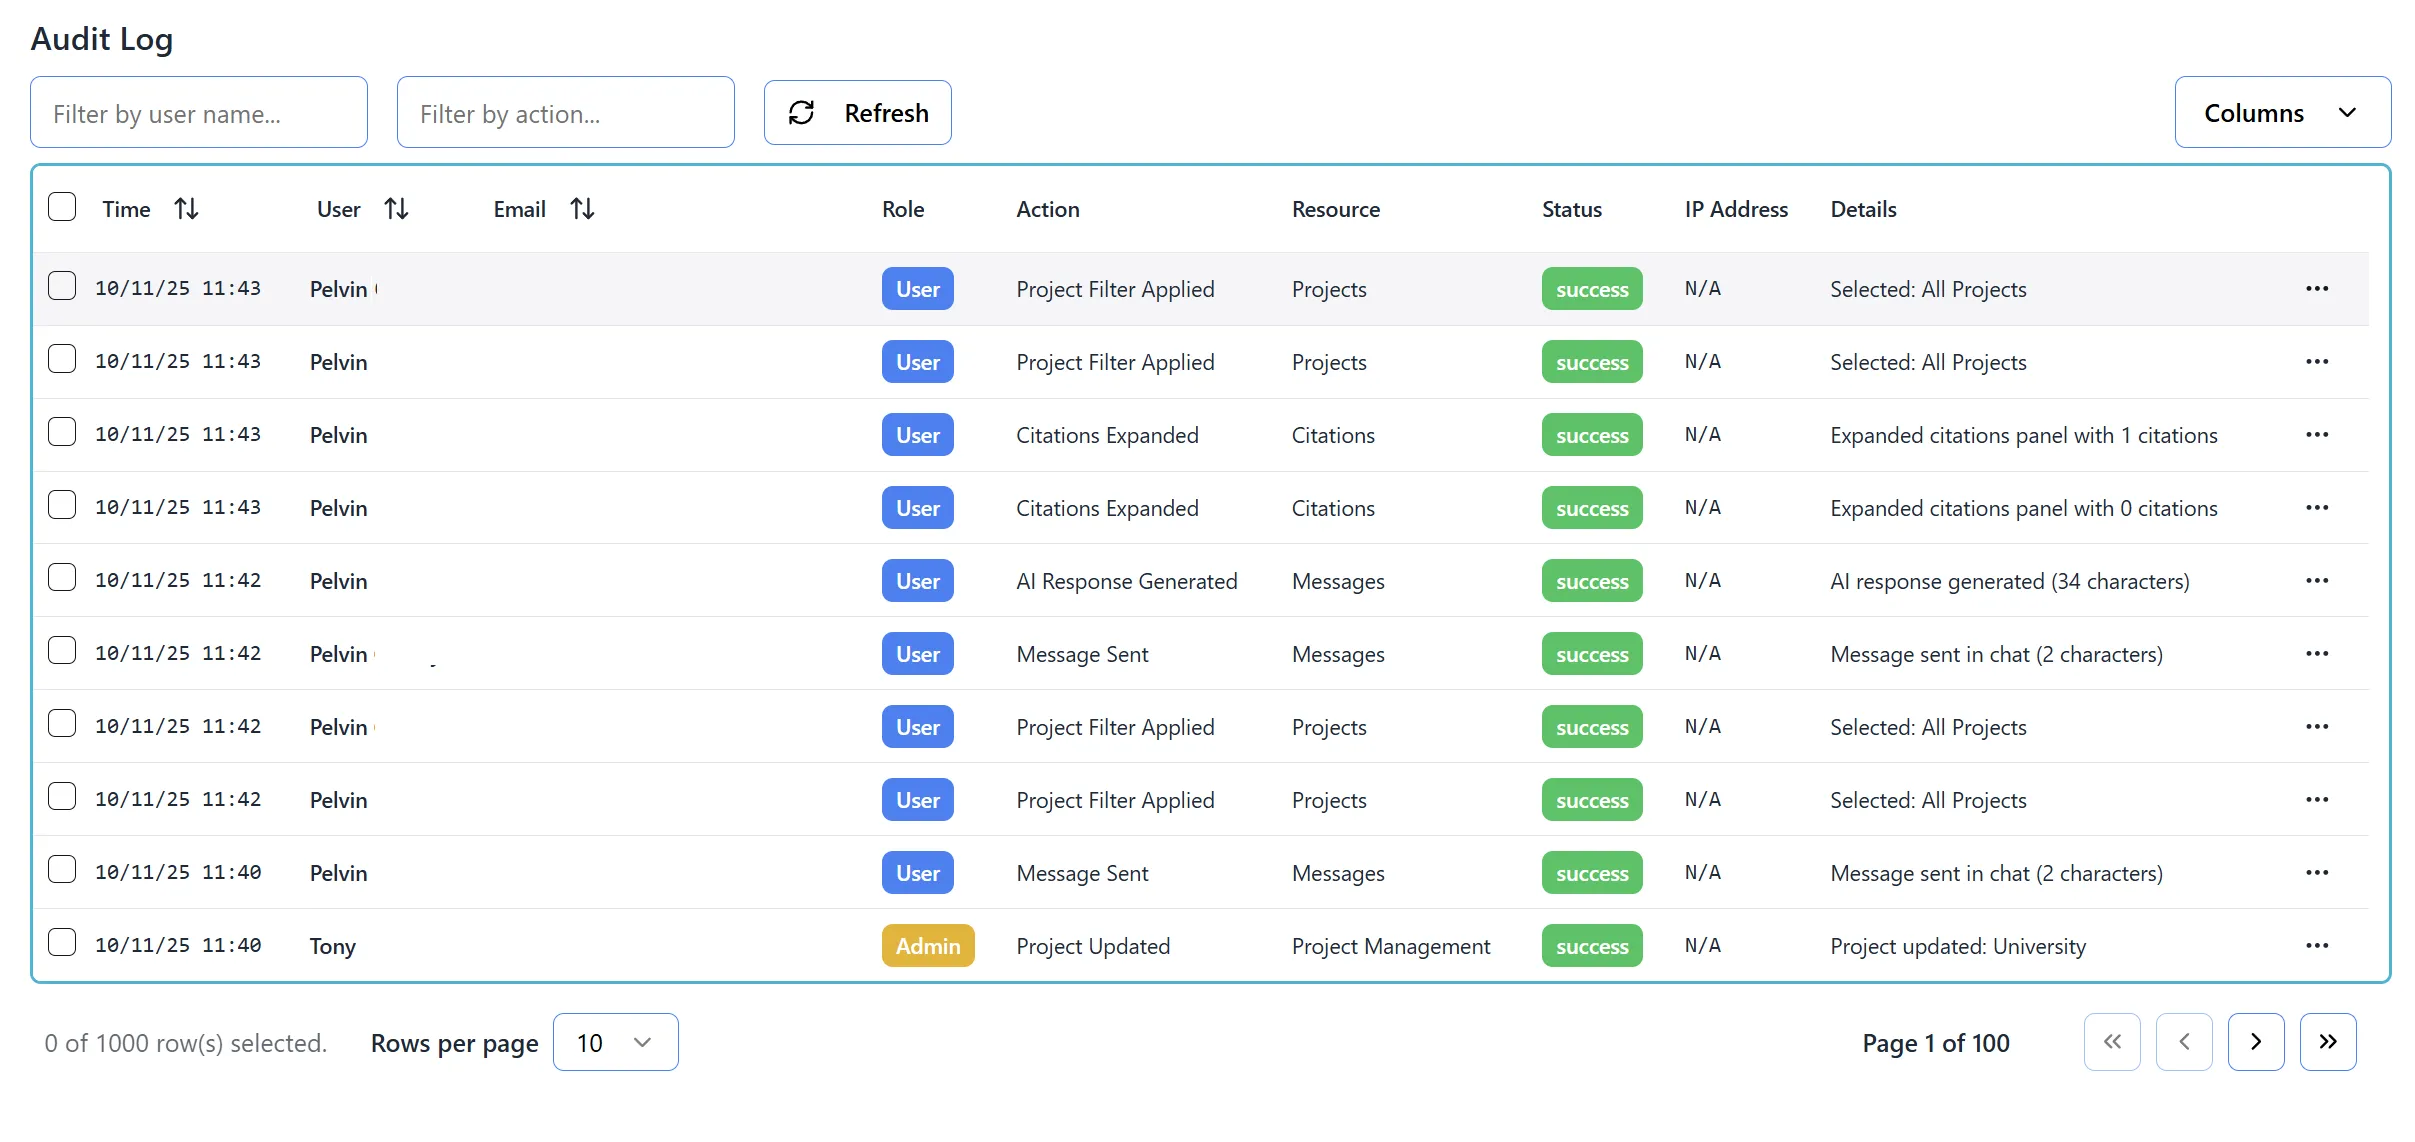
After accessing the Audit Logs tab, you will see a comprehensive table displaying all audit log entries:
Table Columns:
- Select: Checkbox to select individual log entries or all entries on the page
- Time: Displays the timestamp in dd/mm/yy hh:mm format (24-hour time)
- User: Shows the user’s display name (first name + last name, or username, or email)
- Email: Displays the user’s email address
- First Name: User’s first name (hidden by default)
- Last Name: User’s last name (hidden by default)
- User Name: User’s username (hidden by default)
- Role: Shows the user’s role (Admin, User, Third Party) with color-coded tags
- Action: Describes the action performed (e.g., “User Login”, “Document Uploaded”, “Project Created”)
- Resource: Shows the resource type affected (e.g., “User”, “Document”, “Project”)
- Status: Displays the action status (Success, Failed, etc.) with color-coded tags
- IP Address: Shows the IP address from which the action was performed
- Details: Contains detailed information about the action (may be clickable for AI responses, messages, or documents)
- Actions: Three-dot menu (⋮) for additional options
Top Controls:
- Filter by User Name: Search box to filter logs by user name
- Filter by Action: Search box to filter logs by action type
- Refresh Button: Updates the audit log list with the latest data
- Columns Dropdown: Allows you to show/hide specific columns
Filtering Audit Logs
Section titled “Filtering Audit Logs”Step 1: Filter by User Name
Section titled “Step 1: Filter by User Name”- Locate the “Filter by user name…” search box at the top-left of the table
- Type the user’s name (or part of it) you want to search for
- The table will automatically filter to show only logs from matching users
- The filter searches across:
- First name
- Last name
- Username
- Email address
- Display name
- Clear the search box to show all logs again
Step 2: Filter by Action
Section titled “Step 2: Filter by Action”- Locate the “Filter by action…” search box next to the user filter
- Type the action type (or part of it) you want to search for
- Examples of actions include:
- “User Login”
- “Document Uploaded”
- “Project Created”
- “AI Response Generated”
- “Message Sent”
- “Role Changed”
- The table will automatically filter to show only matching actions
- Clear the search box to show all logs again
Step 3: Combine Filters
Section titled “Step 3: Combine Filters”- You can use both filters simultaneously
- The table will show only logs that match both the user filter and the action filter
- Clear both filters to see all logs
Step 4: Sort Columns
Section titled “Step 4: Sort Columns”- Click on any column header that has a sort icon (up/down arrows)
- Click once to sort in ascending order
- Click again to sort in descending order
- Click a third time to remove sorting
- Sortable columns include: Time, User, Email, User Name, and Role
Viewing Log Details
Section titled “Viewing Log Details”Step 1: View Basic Details
Section titled “Step 1: View Basic Details”- Each log entry displays information in the table columns
- Details column shows a summary or full details of the action
- Details may be truncated with ”…” if too long
- Hover over truncated details to see a tooltip with full text
Step 2: View Full Details
Section titled “Step 2: View Full Details”- For truncated details, click on the Details cell
- A tooltip or modal may appear showing the full details
- Some details are clickable and will open additional views (see below)
Step 3: View Log Actions Menu
Section titled “Step 3: View Log Actions Menu”- Click the three-dot menu (⋮) in the Actions column
- A dropdown menu will appear with options:
- Copy log ID: Copies the log entry ID to clipboard
- View details: Opens detailed view of the log entry
- Export log: Exports the individual log entry
Viewing AI Responses and Messages
Section titled “Viewing AI Responses and Messages”Step 1: Identify AI Response Logs
Section titled “Step 1: Identify AI Response Logs”- Look for log entries with action “AI Response Generated”
- These entries indicate when the AI generated a response to a user query
- The Details column will show a preview of the response
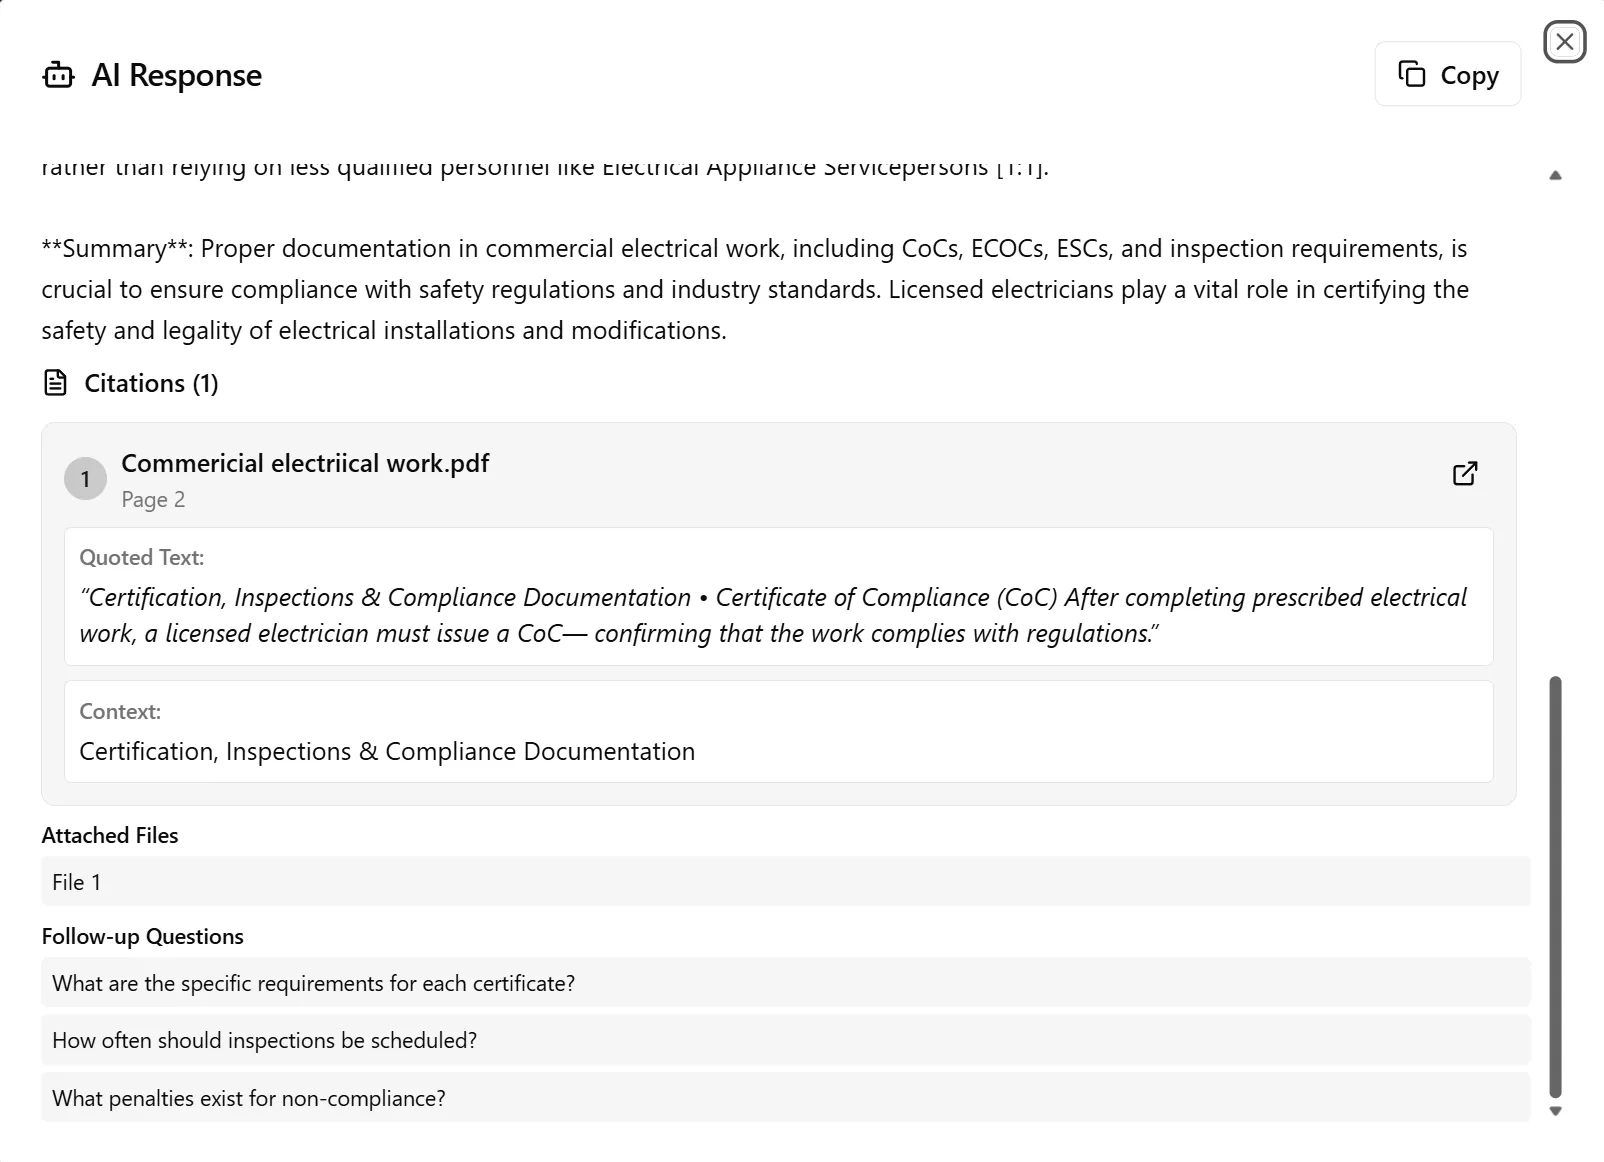
Step 2: View Full AI Response
Section titled “Step 2: View Full AI Response”- Click on the Details text for an “AI Response Generated” entry
- The text will be clickable and highlighted
- A Response Viewer Modal will open showing:
- The full AI response
- Chat context
- Timestamp
- Related information
Step 3: View User Messages
Section titled “Step 3: View User Messages”- Look for log entries with action “Message Sent”
- These entries indicate when a user sent a message
- Click on the Details text for a “Message Sent” entry
- A Response Viewer Modal will open showing:
- The full user message
- Chat context
- Timestamp
Step 4: Close Response Viewer
Section titled “Step 4: Close Response Viewer”- Click outside the modal or press the close button
- Return to the audit logs table
Viewing Documents from Logs
Section titled “Viewing Documents from Logs”Step 1: Identify Document View Logs
Section titled “Step 1: Identify Document View Logs”- Look for log entries with action “Document Viewed”
- These entries indicate when a user viewed a document
- The Details column will show the document filename
Step 2: Open Document from Log
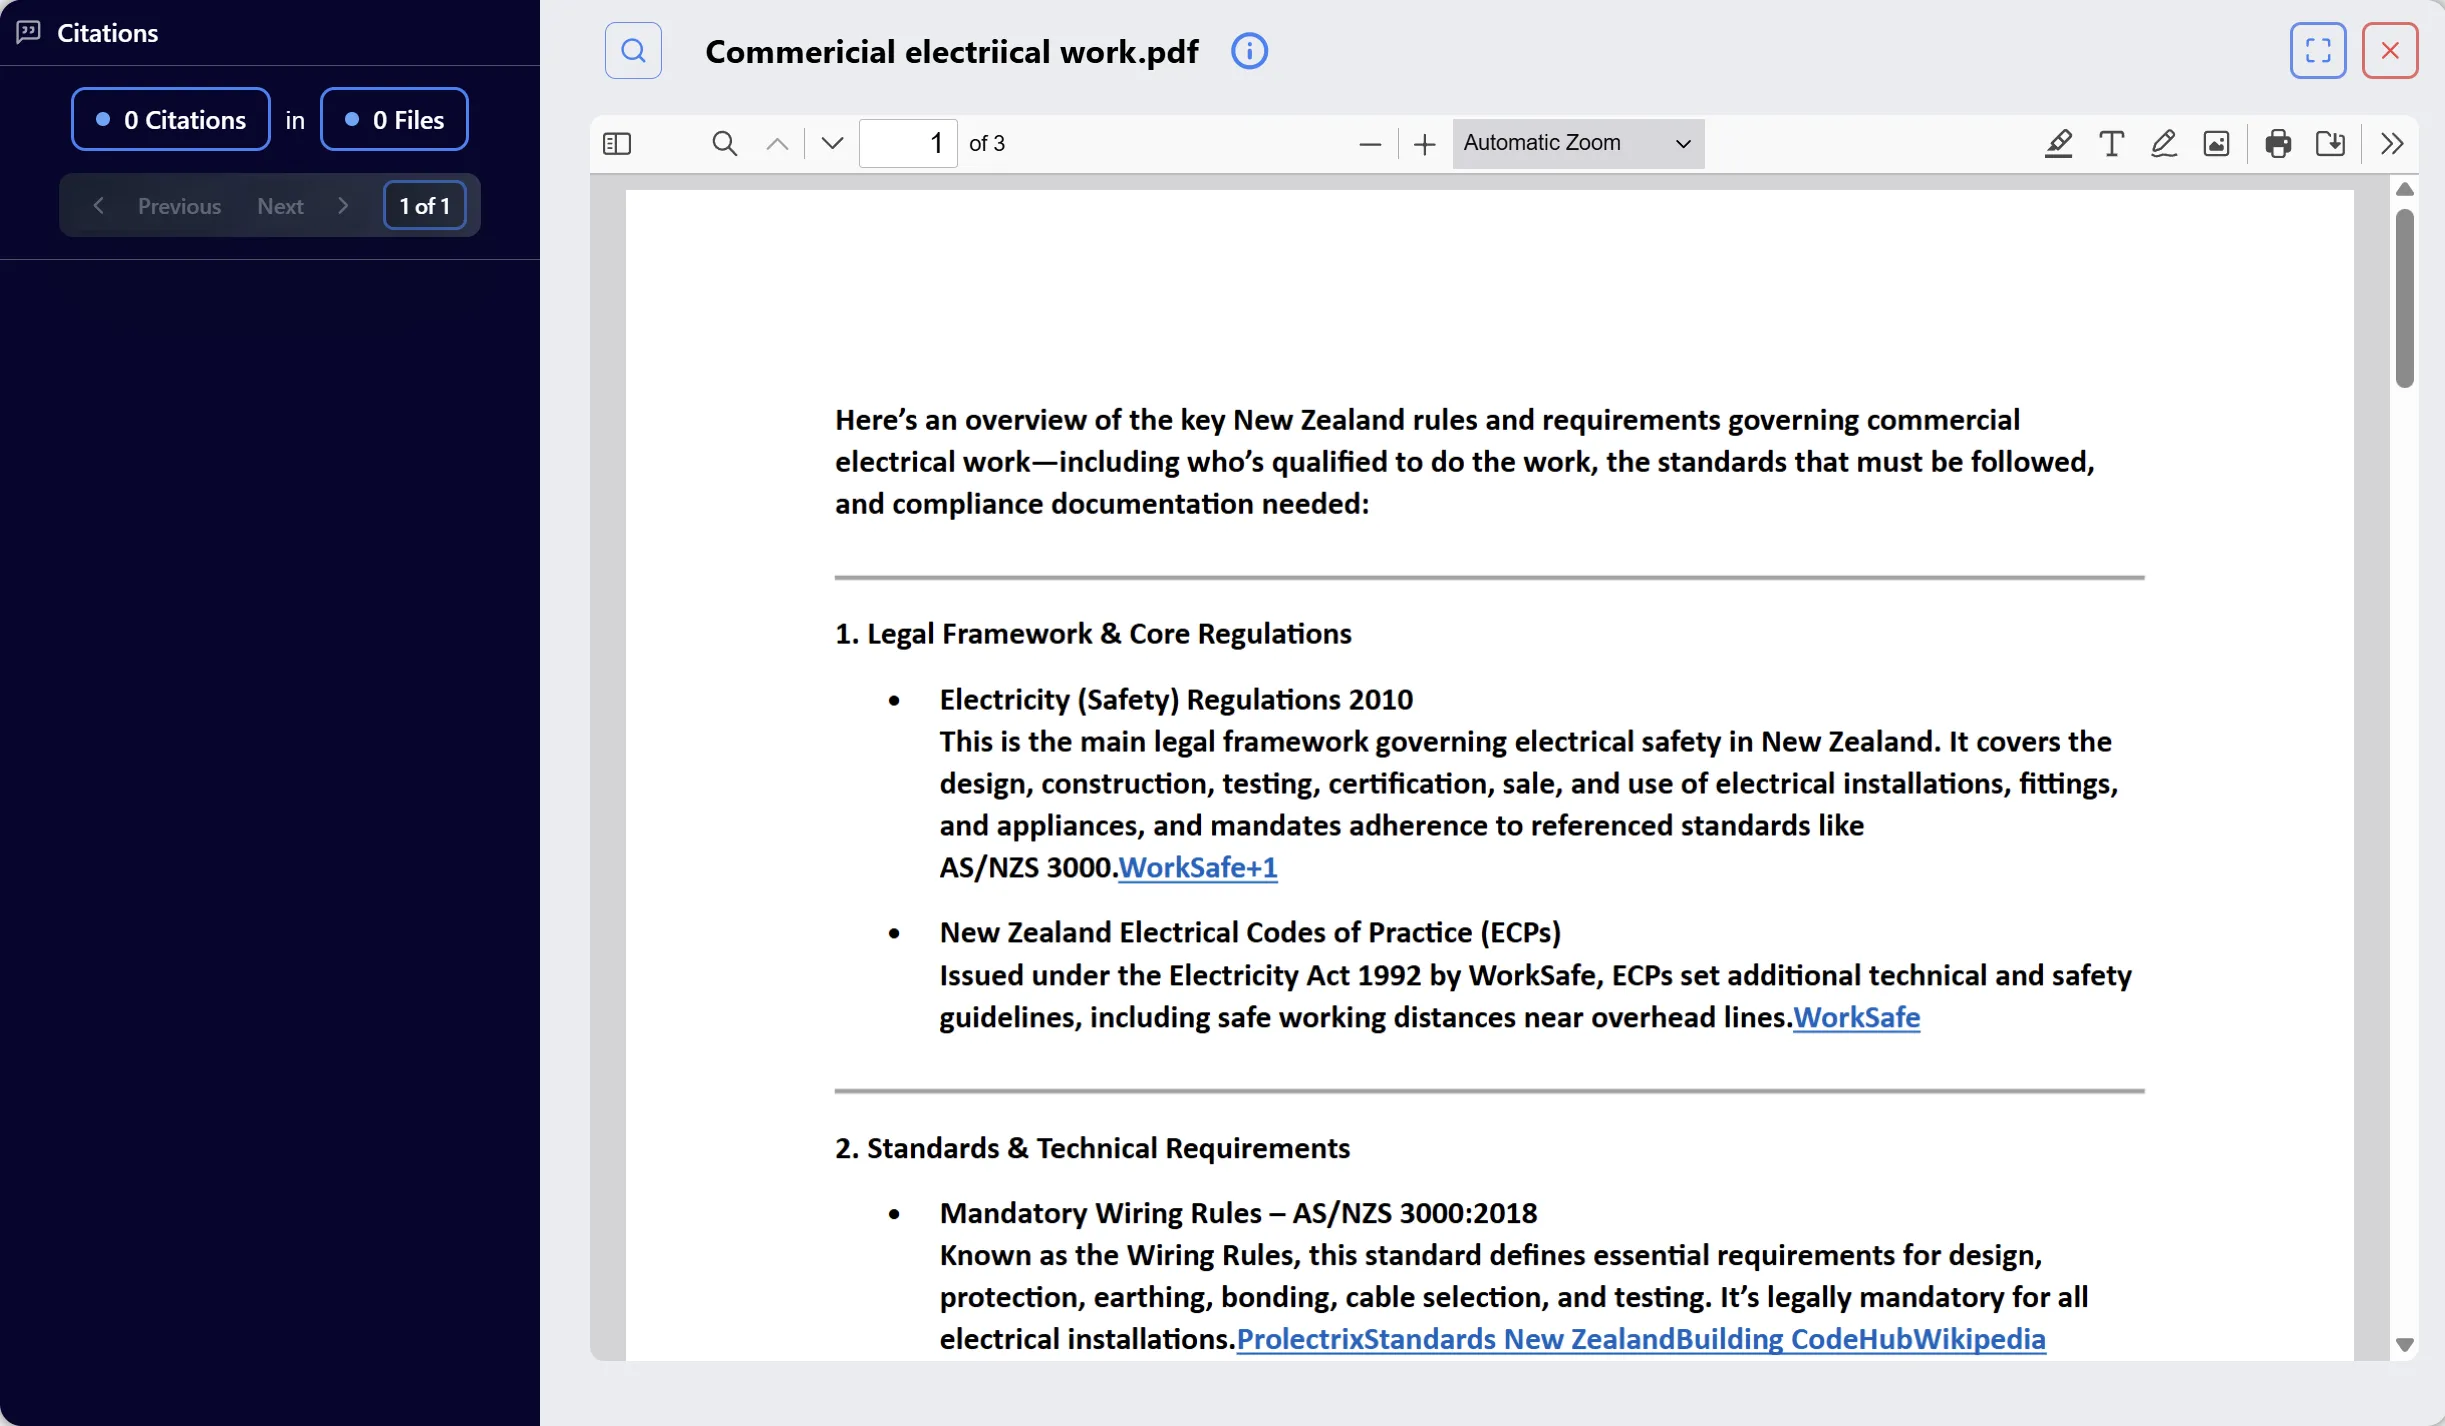
Section titled “Step 2: Open Document from Log”- Click on the Details text for a “Document Viewed” entry
- The text will be clickable and highlighted
- A Document Modal will open showing:
- The document content
- Document metadata
- Document viewer interface
- Related documents (if available)
Step 3: Navigate Document
Section titled “Step 3: Navigate Document”- Use the document viewer controls to:
- Navigate pages
- Zoom in/out
- Search within the document
- View document metadata
- The document opens in the same interface as regular document viewing
Step 4: Close Document Modal
Section titled “Step 4: Close Document Modal”- Click outside the modal or press the close button
- Return to the audit logs table
Note: If a document cannot be found or the URL is unavailable, you may see an error message. This can happen if the document was deleted or the URL was not stored during upload.
Sorting and Organizing Logs
Section titled “Sorting and Organizing Logs”Step 1: Sort by Time
Section titled “Step 1: Sort by Time”- Click the “Time” column header
- Sort in descending order (newest first) to see recent activity
- Sort in ascending order (oldest first) to see historical activity
- This is useful for tracking recent events or reviewing historical logs
Step 2: Sort by User
Section titled “Step 2: Sort by User”- Click the “User” column header
- This groups logs by user name alphabetically
- Useful for reviewing all activities by a specific user
- Combine with user filter for focused user activity review
Step 3: Sort by Action
Section titled “Step 3: Sort by Action”- While the Action column may not be directly sortable, you can:
- Use the Filter by Action to show specific action types
- Review logs grouped by action type
- This helps identify patterns in system usage
Step 4: Sort by Status
Section titled “Step 4: Sort by Status”- Review the Status column to see success/failure rates
- Filter or sort to identify failed actions that may need attention
- Status tags are color-coded for quick identification
Customizing Table View
Section titled “Customizing Table View”Step 1: Show/Hide Columns
Section titled “Step 1: Show/Hide Columns”- Click the “Columns” dropdown button in the top-right area
- A dropdown menu will appear listing all available columns
- Check or uncheck columns to show or hide them
- The table will update immediately to reflect your changes
Step 2: Available Columns
Section titled “Step 2: Available Columns”You can toggle visibility for:
- First Name: Show/hide the first name column (hidden by default)
- Last Name: Show/hide the last name column (hidden by default)
- User Name: Show/hide the username column (hidden by default)
- Email: Show/hide the email column (shown by default)
- Other optional columns as available
Step 3: Default Column Visibility
Section titled “Step 3: Default Column Visibility”By default, the following columns are hidden:
- First Name: Hidden (shown in User column)
- Last Name: Hidden (shown in User column)
- User Name: Hidden (shown in User column)
The following columns are shown by default:
- Email: Visible
- Time: Visible
- User: Visible
- Role: Visible
- Action: Visible
- Resource: Visible
- Status: Visible
- IP Address: Visible
- Details: Visible
Key Features Summary
Section titled “Key Features Summary”Log Viewing Features
Section titled “Log Viewing Features”- Comprehensive Logs: View all system activities and user actions
- Detailed Information: See timestamps, users, actions, resources, and status
- Real-time Updates: Refresh to see latest audit log entries
- Historical Records: Access complete audit trail history
Filtering and Search Features
Section titled “Filtering and Search Features”- User Filter: Filter logs by user name, email, or username
- Action Filter: Filter logs by specific action types
- Combined Filters: Use multiple filters simultaneously
- Sorting: Sort by time, user, email, or other columns
Interactive Features
Section titled “Interactive Features”- AI Response Viewer: Click to view full AI responses from chat logs
- Message Viewer: Click to view full user messages
- Document Viewer: Click to open documents that were viewed
- Copy Log ID: Copy log entry IDs for reference
Organization Features
Section titled “Organization Features”- Column Visibility: Show or hide columns as needed
- Pagination: Navigate through large log datasets
- Export: Export logs for compliance or analysis
Best Practices
Section titled “Best Practices”When Reviewing Audit Logs
Section titled “When Reviewing Audit Logs”- Start with Filters: Use filters to narrow down to specific users or actions
- Sort by Time: Sort by time (newest first) to see recent activity
- Review Failed Actions: Check status column for failed actions that need attention
- Monitor Regular Activity: Regularly review logs to identify patterns
For Compliance and Security
Section titled “For Compliance and Security”- Regular Reviews: Schedule regular audit log reviews
- Export Important Logs: Export logs for compliance reporting
- Track User Activity: Monitor user actions for security purposes
- Document Access: Review document access logs for sensitive information
When Investigating Issues
Section titled “When Investigating Issues”- Filter by User: Use user filter to see all actions by a specific user
- Filter by Action: Use action filter to see all instances of a specific action
- Check Timestamps: Use time sorting to understand the sequence of events
- View Details: Click on details to see full information about actions
Troubleshooting
Section titled “Troubleshooting”Issue: Logs Not Loading
Section titled “Issue: Logs Not Loading”Solutions:
- Click the Refresh button to reload logs
- Check your internet connection
- Verify you have admin privileges
- Contact your system administrator if the issue persists
Issue: Filter Not Working
Section titled “Issue: Filter Not Working”Solutions:
- Clear the filter and try again
- Check for typos in the search text
- Ensure the filter text matches (case-insensitive)
- Refresh the page if the issue persists
Issue: Cannot View Document from Log
Section titled “Issue: Cannot View Document from Log”Solutions:
- The document may have been deleted
- The document URL may not be available
- Check if you have access to the document
- The document may be in a different organization
- Contact your system administrator if the document should be accessible
Issue: AI Response Not Opening
Section titled “Issue: AI Response Not Opening”Solutions:
- Verify the log entry is for “AI Response Generated”
- Check if the chat ID is available in the log metadata
- Refresh the page and try again
- The chat may have been deleted or archived
Issue: Too Many Logs to Review
Section titled “Issue: Too Many Logs to Review”Solutions:
- Use filters to narrow down the results
- Sort by time to focus on recent activity
- Use pagination to review logs in smaller batches
- Export logs for external analysis tools
Security Notes
Section titled “Security Notes”- Only users with admin privileges can access the Audit Logs tab
- Audit logs are read-only and cannot be modified
- All system activities are automatically logged
- Logs include IP addresses for security tracking
- Export logs for compliance and security reporting
- Logs are retained according to your organization’s retention policy
Logged Actions
Section titled “Logged Actions”The following actions are typically logged in the audit trail:
User Actions
Section titled “User Actions”- User login/logout
- User registration
- Password changes
- Profile updates
Document Actions
Section titled “Document Actions”- Document uploads
- Document views
- Document deletions
- Document modifications
Project Actions
Section titled “Project Actions”- Project creation
- Project updates
- Project archiving
- Project restoration
User Management Actions
Section titled “User Management Actions”- User role changes
- User status changes
- User invitations
- User deletions
System Actions
Section titled “System Actions”- Admin panel access
- Settings changes
- Organization changes
- Handover process actions
AI Actions
Section titled “AI Actions”- AI response generation
- Message sent
- Chat creation
- Chat deletion